Homeostasis Diagram
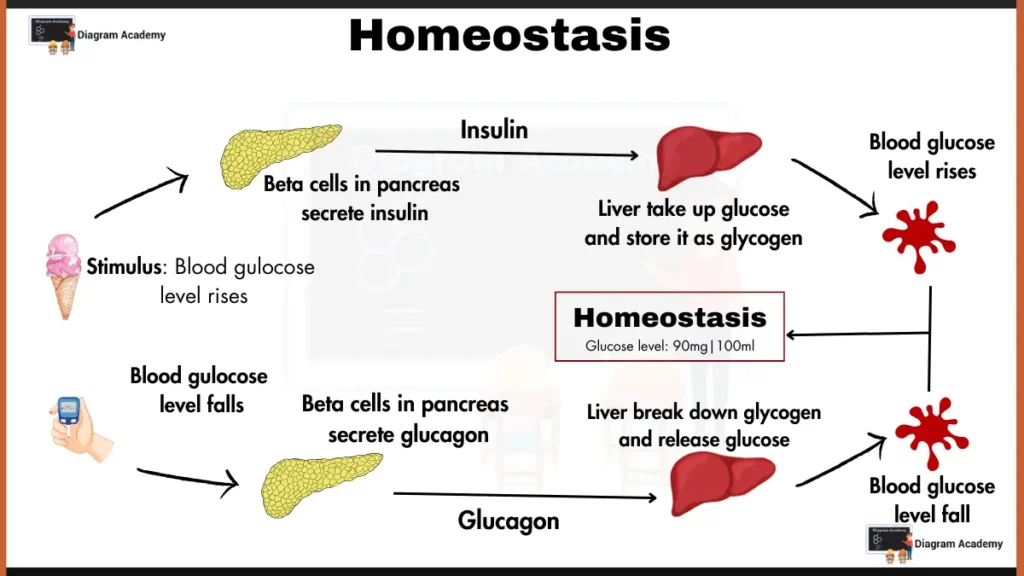
This diagram of Homeostasis mechanism illustrates the process of maintaining homeostasis (stable internal environment) for blood glucose levels in the human body.
1. Key Elements
- Stimulus – Rising blood glucose level above a certain threshold due to food intake.
- Response – Beta cells in the pancreas show response
- Secrete insulin (when blood sugar rises).
- Secrete glucagon (when blood sugar falls).
2. Actions
- Insulin signals cells throughout the body to take up glucose from the bloodstream and store it as glycogen in the liver and muscles (represented by “Liver take up glucose and store it as glycogen”). This reduces blood glucose level.
- Glucagon triggers the liver to break down glycogen and release glucose back into the bloodstream (represented by “Liver break down glycogen and release glucose”). This increases blood glucose level.
3. Maintaining Balance
The diagram depicts two states:
- Blood glucose level rises – When blood glucose level rises, it Stimulates insulin release, leading to decreased blood sugar.
- Blood glucose level falls – When blood glucose level falls, it Stimulates glucagon release, leading to increased blood sugar.
This cycle ensures homeostasis by maintaining blood glucose levels around 90-100 mg/dL.