Thermoregulation Diagram
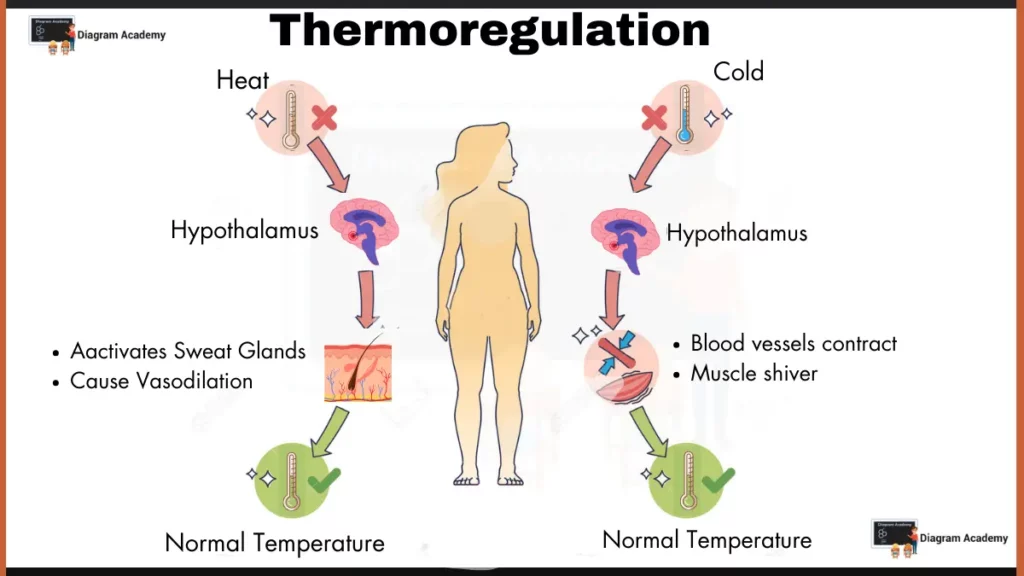
This diagram illustrates the process of thermoregulation, how the body maintains a normal temperature despite changes in the surrounding environment.
1. Key Elements
- Environmental conditions
- Heat – Increases body temperature.
- Cold – Decreases body temperature.
- Body’s response
- Hypothalamus – Acts as the control center for thermoregulation, detecting changes in body temperature and sending signals to various organs.
2. Maintaining Normal Temperature
In Heat
- Hypothalamus detects rise in temperature and sends signals to:
- Sweat glands – They increase sweat production to cool the body through evaporation.
- Blood vessels – They Dilate (widen) near the skin surface, and allow more heat to escape.
In Cold
- Hypothalamus detects fall temperature and sends signals to:
- Blood vessels – They contract (narrow) near the skin surface, conserving heat.
- Muscles – They Shiver, and generate heat through involuntary muscle contractions.
3. Homeostasis
The diagram depicts two states:
- Heat – Triggers sweating and blood vessel dilation, lowering body temperature.
- Cold – Triggers blood vessel constriction and muscle shivering, raising body temperature.
This cycle ensures homeostasis by maintaining normal body temperature.